pythonで波形処理プログラム-ガウスフィット-
ガウスフィット
pythonでガウスフィットさせてその面積を求めるプログラムを作りたいです。
GUIで作りたい。
ひとまず、必要な機能は、
・matplotlibのグラフ上から、ポインタ情報を引っこ抜く
・ガウスフィットさせる
あたりです。
以下のサイトを参考にしました。
python/matplotlibの図上にてクリックで座標値を取得したりキーボード入力値を取得したりする - Qiita
scipy optimizeをつかってみる (Python メモ) | OpenBook
やったことは、
1.ノイズ付きの正規分布をプロット、
2.グラフ上の2点を選択、
3.その間のデータを使ってガウスフィット、
4.フィッティング関数から面積を求める、
1.ノイズ付きの正規分布をプロット
import numpy as np
from scipy.stats import norm
# ベクトルxを [-5.0, ..., 5.0] の区間で作成
x = np.linspace(-1.0, 1.0, 100)

# 平均0, 標準偏差1の正規分布における、xの確率を求める
y = []
for i in range(len(x)):
    y.append(norm.pdf(x=x[i], loc=0, scale=1))

from scipy.optimize import curve_fit
#ノイズを作成
from numpy.random import *
y3 = normal(0.1,0.01,size = 100)

y = y + y3

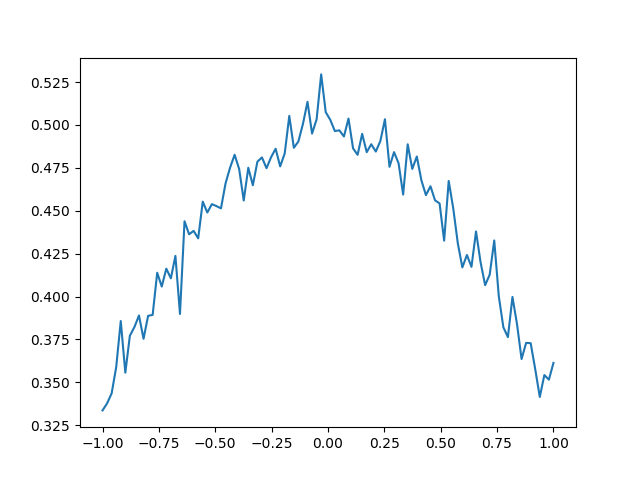
こんな感じのグラフができます。
次は
2.グラフ上の2点を選択、、、
mpl_connectメソッドを使います。
第1引数が"クリック"によってイベント発生ということを指定して、
第2引数がクリックで実施することです。
#グラフ化
fig=plt.figure()
ax=fig.add_subplot(111)
ax.plot(x,y)
#グラフ上でクリックすることで、座標情報をひっぱります。
cid = fig.canvas.mpl_connect('button_press_event', onclick)
plt.show()
onclick関数は以下です。
def onclick(event):
    mask = np.ones(len(x), dtype=bool)
    global stat
    global leftind, rightind
    #stat = 1
    ind = np.searchsorted(x, event.xdata)
    plt.title("You clicked index=" + str(ind))
    print(stat,event.button)
    if event.button == 3 and stat == 1:
        leftind = ind
        ax.plot([x[ind]], [y[ind]], ".", color="red")
        stat = 2
    elif event.button == 3 and stat == 2:
        rightind = ind
        ax.plot(x[leftind:rightind], y[leftind:rightind], color="red")
        stat = 3

        gauss_return = gauss_fit(x[leftind:rightind],y[leftind:rightind])
        ax.plot(gauss_return[0],gauss_return[1], color="red")
        print(integ(x[leftind],x[rightind]))
    elif event.button == 1 and event.dblclick == 1 and stat == 3:
        plt.title("Approved")
        mask[leftind:rightind] = False
        stat = 1

    elif event.button == 2 and stat == 3:
        plt.title("Canceled")
        ax.plot(x[leftind:rightind], y[leftind:rightind], color="blue")
        ax.plot([x[leftind]], [y[leftind]], ".", color="green")
        stat = 1
    fig.canvas.draw()
def gauss_fit(x,y):
    global popt,pcov
    popt, pcov = curve_fit(gaussian,x,y)
    x_range = np.linspace(x[0], x[-1], 100)

    y_gauss = gaussian(x_range, np.ones(100) * popt[0], np.ones(100) * popt[1],
                  np.ones(100) * popt[2], np.ones(100) * popt[3])

    return x_range,y_gauss

def gaussian(x, a, mu, c, gamma):
    return a * np.exp(- gamma * (x - mu) ** 2) + c

def func(x):
    return popt[0] * np.exp(-popt[3] * (x - popt[1]) ** 2) + popt[2]

def integ(left,right):
    return integrate.quad(func,left,right)
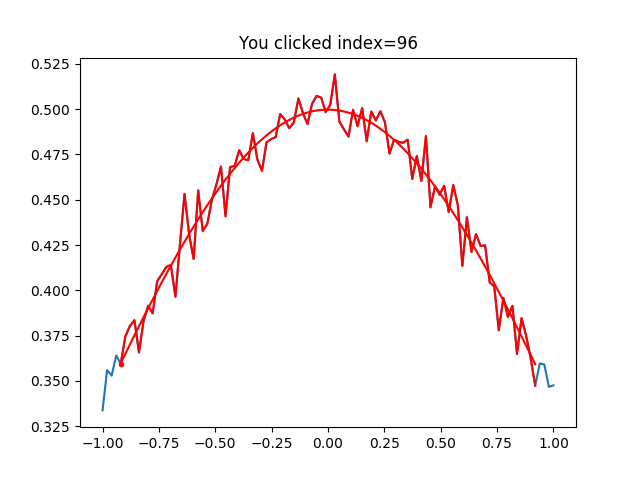
ちなみにこんな感じでフィッティングされます。
