■
deming regression
回帰直線を引くときに、横軸にも誤差がある場合はdeming regressionという方法で 回帰直線をひく必要があります。 deming regressionとタイトルにありますが、 別名で直行回帰(Orthogonal distance regression)ともいうらしいです。
scipyにOrthogonal distance regressionが実装されていたのでそいつを活用、
以下参考サイト、 ・scipyの公式サイト https://docs.scipy.org/doc/scipy/reference/odr.html ・deming regressionの説明 産総研の方による説明です。 https://staff.aist.go.jp/t.ihara/deming0.html ・deming regression
import numpy as np
from pandas import DataFrame

from sklearn.datasets import load_boston
from scipy.odr import Model, RealData, ODR
import matplotlib.pyplot as plt

from scipy.stats import linregress
#%matplotlib inline

#例によってボストンのデータを使います
boston = load_boston()

# 説明変数をDataFrameへ変換
df = DataFrame(boston.data, columns = boston.feature_names)
#目的変数をデータフレームに追加
df['MEDV'] = np.array(boston.target)

x = df["RM"].tolist()
y = df["MEDV"].tolist()

#deming regressionで使用する、関数を定義
def f(B, x):
    '''Linear function y = m*x + b'''
    # B is a vector of the parameters.
    # x is an array of the current x values.
    # x is in the same format as the x passed to Data or RealData.
    #
    # Return an array in the same format as y passed to Data or RealData.
    return B[0]*x + B[1]

linear = Model(f)

#scipyのlinregressで線形回帰、
##odrする際の、初期値を決めるためです、
linreg = linregress(x, y)
mod = Model(f)

#生データの代入、sx,syは,目的変数、説明変数のばらつきの標準偏差です。
#odrメソッドの引数に、目的変数、説明変数のばらつき、初期値を入力します。
dat = RealData(x, y,sx=1,sy=1)
od = ODR(dat, mod, beta0=linreg[0:2])
out = od.run()

fig = plt.figure()
subplot = fig.add_subplot(1,1,1)

subplot.scatter(x,y)
#linex = np.linspace(6.5,8,100)
#liney = out.beta[0]*linex + out.beta[1]
#subplot.plot(linex,liney)
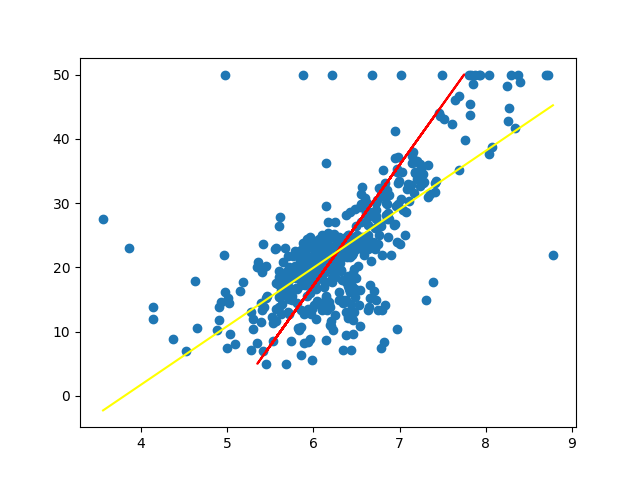
subplot.plot(out.xplus,out.y,color='red')

#普通に線形回帰した場合の直線もひいてみます。
x_max = max(x)[f:id:satopoooon:20180326230958p:plain]
x_min = min(x)
linex = np.linspace(x_min,x_max,100)
liney = linreg[0]*linex + linreg[1]
subplot.plot(linex,liney,color='yellow')

plt.show()
実行すると、こんな感じになります。
